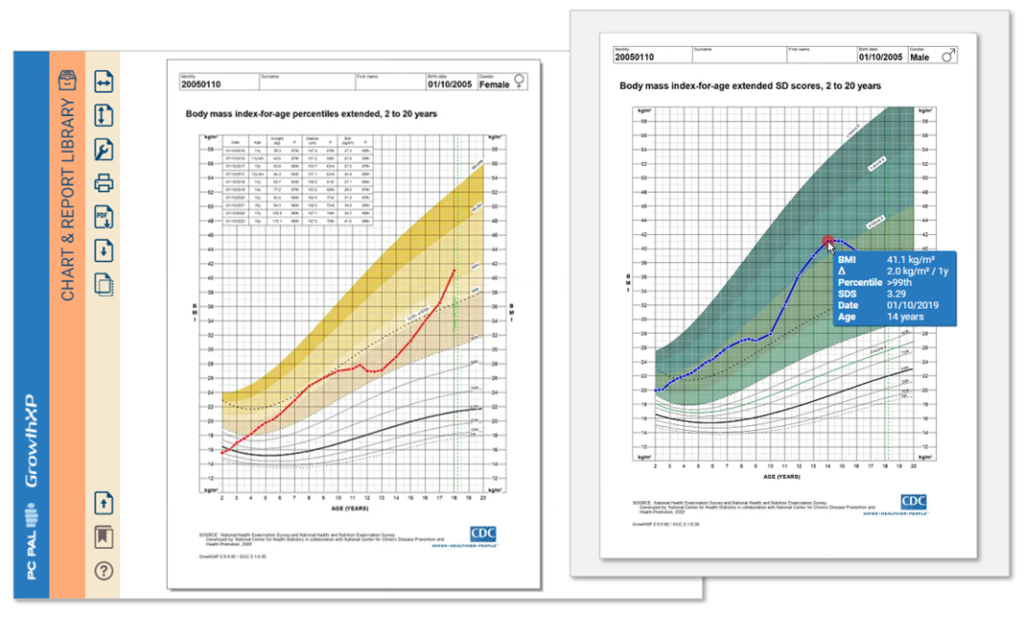
The CDC has released new BMI charts for 2-18-year-olds, which provide curves above the 97th percentile (98th, 99th, 99.9th and 99.99th). These charts address a weakness of the earlier versions: for most obese individuals they suffered from data weakness above 97th percentile, relying on data extrapolation rather than real data. The new charts are based on real measurements and are designed to reliably differentiate significant differences in BMI.
Clinicians now have access to the CDC’s new BMI charts in GrowthXP.
The new curves accurately cover individuals up to a BMI of 60 and BMI z-score of 5, greatly improving on the previous limit of values beyond the 97th percentile. The CDC emphasizes that the threshold for severe obesity has not changed and that the 2000 BMI-for-age growth charts are applicable to growth monitoring of children without obesity.
The advice for clinical practice is to use the new 2022 charts to replace the growth charts for severely obese children found in the Electronic Health Chart.
Using BMI percentiles to visualise results of weight loss might not reveal the significance of the outcome on weight. GrowthXP users can easily switch BMI SDS values, which do correlate linearly with the change in BMI.

BMI CGM Medico child growth Electronic Health Record ESHG ESPE growth charts growth hormone GrowthXP Hennenberg Kabi International Growth Study KIGS neonatal hyperbilirubinemia PAS Pediatric Endocrine Society Pedigree analysis PedigreeXP skinfold thickness Skolnik N Visaria A Żądzińska
BMI CGM Medico child growth Electronic Health Record ESHG ESPE growth charts growth hormone GrowthXP Hennenberg Kabi International Growth Study KIGS neonatal hyperbilirubinemia PAS Pediatric Endocrine Society Pedigree analysis PedigreeXP skinfold thickness Skolnik N Visaria A Żądzińska